
How to Calculate Return on Ad Spend: The Ultimate Guide
To calculate return on ad spend, you just divide the total revenue your ads generated by the total cost of those ads. This simple formula cuts right to the chase, showing you exactly how much money you’re making for every single dollar you put into advertising. It’s an absolutely essential report card for your marketing efforts.
Calculating ROAS: The Core Formula and Why It Matters

Return on Ad Spend (ROAS) is your go-to metric for measuring the raw effectiveness of your advertising. It tells you, in plain dollars and cents, how much revenue you got back for what you spent.
Let’s say you spend $10,000 on a Google Ads campaign and it generates $50,000 in sales. Your ROAS is 5. That means for every $1 you invested, you earned $5 back. Simple as that.
In a world full of vanity metrics like clicks and impressions, ROAS is your financial North Star. It provides a direct scorecard for your campaigns, showing what’s actually moving the needle.
The Basic ROAS Formula
At its heart, the calculation is refreshingly straightforward:
ROAS = Total Revenue from Ads / Total Ad Cost
This single number tells a powerful story. A ROAS above 1 means you're in the black—you're generating more revenue than you're spending. A figure below 1 means you’re losing money on that campaign.
To make this crystal clear, here’s a quick breakdown of what goes into the formula.
ROAS Calculation At a Glance
This table simplifies the two key ingredients you'll need.
| Revenue from Ads | The total sales value directly attributed to a specific ad campaign. | $50,000 |
|---|---|---|
| Total Ad Cost | All the money spent to run that ad campaign, including clicks, fees, and services. | $10,000 |
Once you have these two figures, you just plug them into the formula to get your ROAS. In this case, $50,000 / $10,000 = 5.
A common benchmark many advertisers shoot for is a 4:1 ratio ($4 in revenue for every $1 spent), but take that with a huge grain of salt. It's not a universal rule by any means. Your ideal target depends entirely on your business.
Why Your "Good" ROAS Is Unique
There’s no magic number that defines success for every business. What’s fantastic for one company could be a disaster for another. Your target ROAS will shift based on a few critical factors:
- Profit Margins: A business selling high-margin luxury watches can get by with a lower ROAS than a t-shirt company with razor-thin margins. The more profit you make per sale, the more breathing room you have.
- Operating Expenses: Your initial ROAS calculation doesn’t account for things like shipping, salaries, or the cost of goods sold. To find your true profitability, you have to factor in all those other expenses eventually.
- Business Goals: What are you trying to achieve right now? If your goal is rapid growth and grabbing market share, you might be perfectly happy with a lower ROAS. But if you’re focused on maximizing immediate profit, you’ll need a much higher number.
Think of ROAS as your starting point for deeper strategic analysis. For a more in-depth look at the formula and how to apply it, check out this a comprehensive guide to calculating ROAS accurately.
How to Gather the Right Data for an Accurate ROAS
Your ROAS calculation is only as good as the data you feed it. That old saying, "garbage in, garbage out," isn't just a cliché—it's a warning for every digital marketer. To land on a number you can actually trust and build a strategy around, you have to be meticulous about tracking down your two key figures: total ad cost and attributed revenue.
Sounds simple, right? The devil is in the details. Getting these two numbers right is the most critical part of the entire process.
Pinpointing Your Total Ad Cost
At first glance, finding your total ad spend seems easy. Just pop open your ad platform’s dashboard, right? Mostly, but don’t stop there. True ad cost goes beyond what you paid for clicks and impressions, and ignoring the hidden extras can seriously skew your results.
Think about all the other money that went into making those ads happen:
- Platform Fees: This is the obvious one—the direct cash you handed over to Google, Meta, or LinkedIn to run the campaigns.
- Agency or Freelancer Fees: If you’ve outsourced your campaign management, the fees you’re paying that agency or contractor are absolutely part of your ad cost.
- Third-Party Tool Subscriptions: Paying for a slick bidding software, an analytics tool, or a creative platform to design your ads? A portion of those subscription costs should be factored in.
- Content Creation Costs: Did you hire a designer for the graphics or a copywriter to nail the ad text? Those expenses are part of your investment.
Leaving out these "soft costs" will artificially pump up your ROAS, giving you a false sense of success. For a true picture of business-level profitability, you need to account for every single dollar spent.
For a quick, dirty, campaign-level check? Sure, just using the direct ad platform spend is fine. But for a real profitability analysis, you need the complete picture.
Untangling Revenue Attribution
Okay, this is where things get messy. Figuring out which ad actually gets credit for a sale is one of the biggest headaches in digital marketing.
Imagine this scenario: a customer sees your ad on Facebook, clicks a Google search ad a day later, and then finally makes a purchase after seeing a retargeting ad on a news site. Which ad sealed the deal?
The answer comes down to your attribution model. This is basically the rulebook you use to assign credit for conversions across all the different touchpoints in a customer's journey.
There are a couple of common ways to slice it:
- Last-Click Attribution: This is the simplest and, for a long time, the most common model. It gives 100% of the credit to the very last ad a customer clicked before buying. It’s easy to track, but it often completely ignores the ads that introduced your brand in the first place.
- Multi-Touch Attribution: This is a much more sophisticated approach. It spreads the credit across multiple touchpoints, acknowledging that several ads probably played a role in the final decision. Models like linear, time-decay, or position-based attribution each assign value in slightly different ways.
Picking the right model is a huge deal for an accurate ROAS. Last-click might be an okay place to start, but as your marketing gets more complex, exploring multi-touch models will give you a much clearer view of what’s really working.
To go deeper on this, our guide on what is attribution modeling is a fantastic breakdown of the different options. Ultimately, your goal is to make your measurement match how your customers actually behave.
A Real-World Walkthrough of Calculating ROAS
Theory is great, but let's get our hands dirty. The best way to really wrap your head around ROAS is to walk through a real-world scenario from start to finish.
We'll follow a fictional e-commerce brand, "Artisan Mugs Co.," as they dig into their monthly advertising performance.
Artisan Mugs Co. ran a targeted campaign across two of their main channels: Google Search Ads and Facebook Ads. The mission? Drive direct sales for a slick new line of handcrafted ceramic mugs. Now it's time to crunch the numbers and see if that investment actually paid off.
Compiling the Ad Spend
First things first, we need to figure out the total ad cost. This means pulling data straight from each ad platform’s dashboard. It's absolutely critical to make sure the timeframes are perfectly aligned—for this example, we'll use the entire month of May.
- Google Ads Spend: After hopping into their campaign report, Artisan Mugs Co. finds they spent $1,500 on their search campaigns.
- Facebook Ads Spend: Over in the Meta Ads Manager, their total cost for the exact same period was $1,000.
This gives us a pretty straightforward total.
Total Ad Cost = $1,500 (Google) + $1,000 (Facebook) = $2,500
This number is the "Cost of Ads" part of our formula. It’s the total cash they shelled out for the month's promotions. If you want a deeper dive into what counts as an ad cost, our Google Ads calculator can help you account for all the little variables.
Attributing the Revenue
Next up is the trickier part: figuring out how much revenue came directly from those ads. Artisan Mugs Co. uses Google Analytics 4 (GA4) with proper conversion tracking to nail this down. By filtering their traffic acquisition report by paid channels, they can isolate every sale that started with a click on one of their ads.
After setting the date range for May, their GA4 report shows $9,000 in revenue attributed to their paid search and paid social campaigns. This is the "Revenue from Ads" figure we need for our calculation.
This simple flow chart visualizes how we take separate ad spend and revenue data to get our final ROAS number.
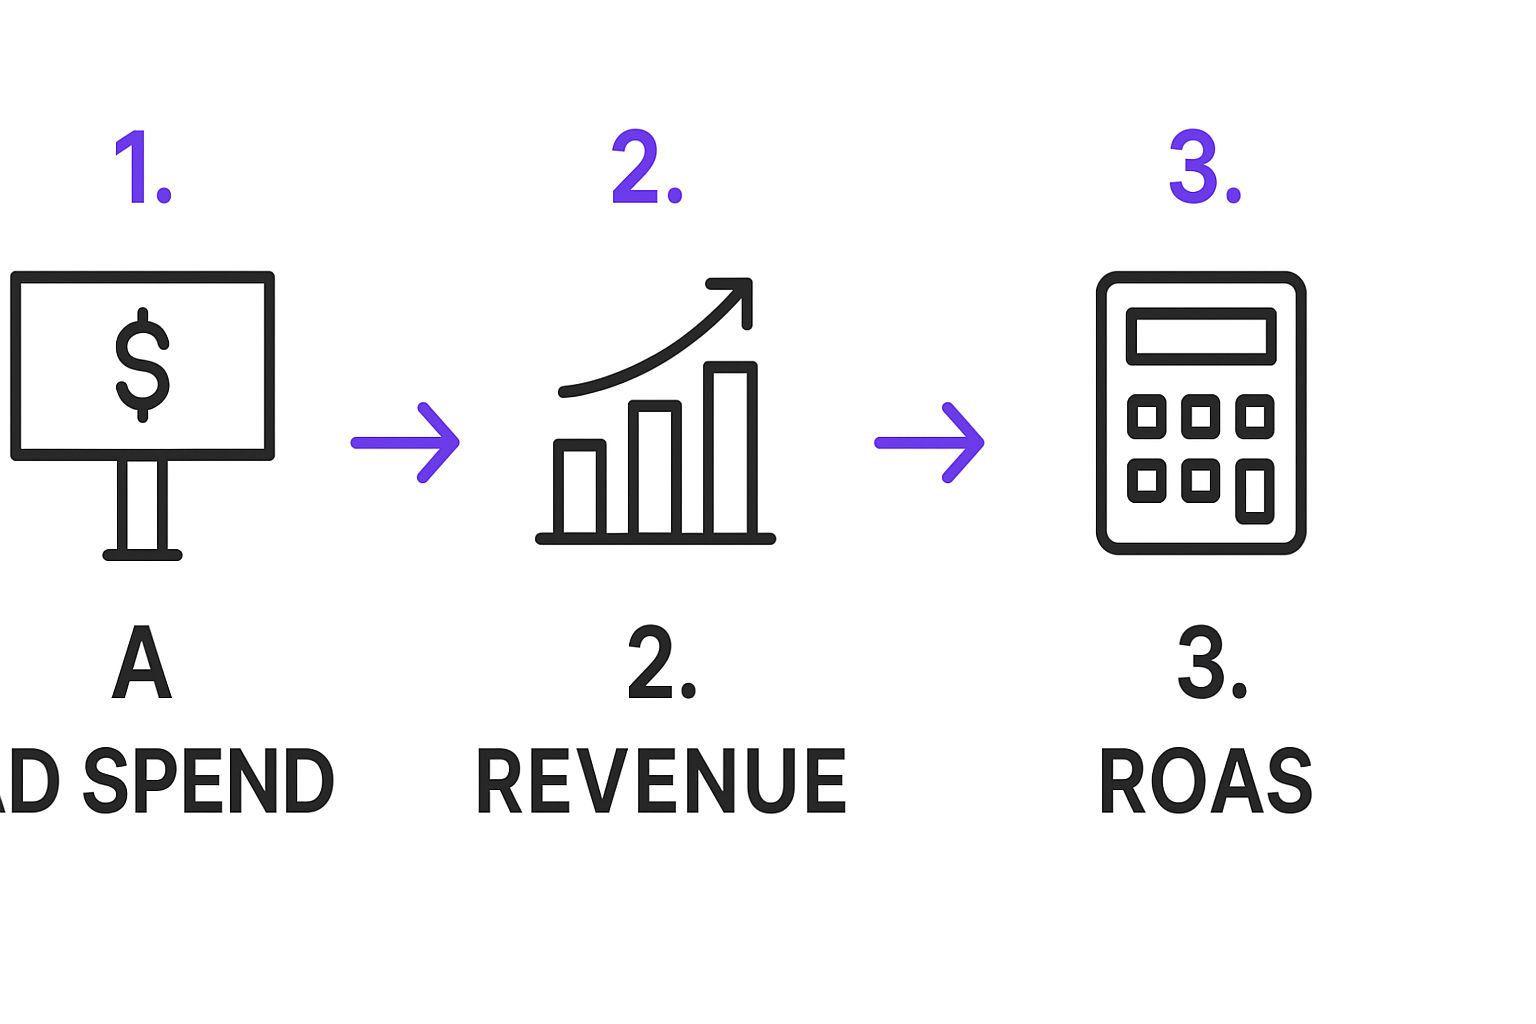
The visual makes it super clear: inputs (spend and revenue) go in, and the final output (ROAS) comes out. Easy to follow.
The Final ROAS Calculation
With both key figures in hand, the final calculation is a breeze. We just use the core formula we've been talking about:
ROAS = Revenue from Ads / Cost of Ads
Let’s plug in the numbers for Artisan Mugs Co.:
ROAS = $9,000 / $2,500 = 3.6
What does this actually mean? For every $1 Artisan Mugs Co. spent on advertising in May, they generated $3.60 in revenue. You'll often hear this expressed as a 3.6x ROAS or a 3.6:1 ratio.
Key Takeaway: That final number, 3.6, isn't just a metric to stick in a report; it's a decision-making tool. It tells the brand that, on the surface, their advertising is bringing in more money than it costs. The crucial next step is to weigh this against their profit margins and overall business goals to determine if it's truly a "good" ROAS for them.
What Your ROAS Number Is Actually Telling You
You've done the math and now you’re staring at a single, clean number. So, what does that figure—whether it's a stellar 8x or a concerning 1.5x—really mean for your business? A high ROAS can feel like a huge win, but it can also be a dangerous vanity metric if it isn't translating into real, take-home profit.

Interpreting your results like a seasoned strategist means looking beyond the surface. It’s a shift from just chasing a high score to using ROAS as a true gauge of profitable, sustainable growth. The real question isn't "is my ROAS high?" but rather, "is my ROAS profitable?"
Defining a Good ROAS for Your Business
There’s no magic number here. A 4:1 ratio is often tossed around as a benchmark, but that’s essentially meaningless without context. What’s phenomenal for a high-margin software company could easily bankrupt a low-margin t-shirt shop.
Your target ROAS is entirely unique to your business's financial reality. To set a realistic goal, you have to get your hands dirty and dig into your own numbers.
Start by looking at these core components:
- Profit Margins: This is the big one. If your profit margin is 70%, a 2x ROAS might still be incredibly profitable. But if your margin is only 25%, a 3x ROAS would actually be losing you money after all other costs are paid.
- Cost of Goods Sold (COGS): You have to account for what it costs to produce whatever you sell. This includes materials, manufacturing, and any other direct expenses that eat into your revenue before you even think about marketing.
- Operating Expenses: Don't forget about overhead. Things like salaries, software subscriptions, rent, and shipping costs are all part of the equation. Your ad campaigns need to generate enough revenue to help cover these, too.
A simple way to think about it is to figure out your break-even point. If your total profit margin on a product is 50%, your break-even ROAS is 2x. Anything above that is profit; anything below is a loss.
From Vanity Metric to Profitability Gauge
Focusing solely on ROAS without considering profit is a classic rookie mistake that leads to bad decisions.
Imagine you're running two campaigns:
- Campaign A: Spends $100 to generate $1,000 in revenue (10x ROAS).
- Campaign B: Spends $5,000 to generate $20,000 in revenue (4x ROAS).
At first glance, Campaign A looks like the clear winner with its 10x ROAS. But hold on. Campaign B delivered $15,000 in gross profit, dwarfing the $900 from Campaign A. If both campaigns are profitable based on your margins, which one is actually moving the needle for business growth? It's not always the one with the higher ratio.
Understanding ROAS in this larger economic context is crucial. With global ad spending forecasted to hit $1.03 trillion next year, the pressure to get this right is immense. Businesses are leaning hard on paid media, and every dollar has to count.
To get these deeper insights, you need solid reporting that lays out the data clearly. Strong platforms provide comprehensive PPC reporting to help you slice and dice performance metrics effectively. Ultimately, the goal is to align your ROAS targets with what truly matters: your bottom line.
Actionable Strategies to Dramatically Improve Your ROAS
Okay, so you've calculated your ROAS. Knowing the number is step one, but the real magic happens when you use that insight to make smarter decisions and fatten up your returns.
When you boil it all down, improving your ROAS is about pulling one of two levers: you either need to make more money from your ads, or you need to spend less to get those sales. The best strategies, of course, manage to do a little of both.
This isn't about finding some mythical "optimize" button. It's about methodically tweaking every part of your campaign, from who sees your ad to what they experience after the click. Every single adjustment, no matter how small it seems, can stack up and have a huge impact on your final number.
Sharpen Your Audience Targeting
One of the fastest ways to absolutely torch your ad budget is showing your ads to the wrong crowd. It’s like trying to sell snow cones in Antarctica. The more precisely you can dial in your audience, the less cash you'll waste on clicks that were never going to convert anyway. This is a direct attack on the "cost" side of the ROAS equation.
Go way beyond basic demographics. Dig into your customer data, build out some detailed personas, and really put the platform's tools to work for you.
- Create Lookalike Audiences: Platforms like Meta are brilliant for this. You can upload a list of your absolute best customers, and the algorithm will go out and find a fresh audience of new people who share similar traits. It's a ridiculously powerful way to expand your reach to people who are already primed to love what you do.
- Implement Exclusion Targeting: Don't forget to tell the ad platforms who you don't want to see your ads. This is just as important. Exclude people who just bought from you from seeing your top-of-funnel ads. Cut out audiences that have a history of low engagement. Stop wasting impressions.
By constantly refining who sees your ads, you ensure every dollar is concentrated on the users most likely to pull out their wallets.
Optimize Your Landing Page Experience
Your ad can be a masterpiece—a true work of art. But if the landing page it sends people to is slow, confusing, or just feels a bit sketchy, you've just paid for a click that's going straight into the void. A frictionless landing page experience isn't a "nice-to-have"; it's completely non-negotiable for turning ad clicks into actual revenue.
Remember, your ad makes a promise, and your landing page has to deliver on it. A sky-high bounce rate is a massive red flag that you're failing to connect the two, and you might as well be lighting your ad budget on fire.
Focus on creating a dead-simple path to conversion. That means your page has to load lightning-fast (especially on mobile), your value proposition needs to be front and center, and your call-to-action button should be impossible to miss. If your ROAS is in the gutter, a clunky landing page is often the prime suspect. For a deeper dive, check out our guide on how to improve website conversion rates—it's packed with tips you can use right away.
Continuously Test and Refine Your Ad Creative
Complacency is the silent killer of a great ROAS. The ad creative that was crushing it last month might be totally stale today. You have to be in a constant state of testing, always trying to find what resonates right now with your audience.
Systematically A/B test every component of your ads to find those winning combinations. This means testing:
- Headlines: Try out different angles. Ask a question, state a clear benefit, or create a little urgency.
- Images/Videos: Pit lifestyle shots against clean product-focused images. See if a quick, punchy video out-performs a static graphic.
- Ad Copy: Experiment with longer, story-driven copy versus short, scannable benefit lists.
- Calls-to-Action (CTAs): Does "Shop Now" work better than "Learn More"? You won't know until you test it.
This relentless cycle of testing, learning, and optimizing is what keeps your campaigns fresh and ensures you're always iterating your way toward a higher return.
Improving your ROAS involves a mix of tactics that either reduce your ad costs or increase the revenue from each click. To help visualize this, think of your options as different levers you can pull.
ROAS Optimization Levers
| Audience Refining | Decreases Cost | Use exclusion lists to stop showing ads to recent buyers or low-intent audiences. |
|---|---|---|
| Ad Creative Testing | Increases Revenue | A/B test a benefit-driven headline against a question-based headline to see which drives more clicks. |
| Landing Page Optimization | Increases Revenue | Improve page load speed by 1 second to reduce bounce rate and increase conversions. |
| Bid Strategy Adjustment | Decreases Cost | Switch from a manual CPC bid to an automated "Maximize Conversions" strategy. |
| Offer & Promotion Testing | Increases Revenue | Test a "15% Off" offer against a "Free Shipping" promotion to see which has a higher average order value. |
Ultimately, each of these tactics plays a crucial role. The key is to find the right combination that moves the needle for your specific business and campaigns.
Common Questions About Calculating ROAS
The ROAS formula looks simple on paper, but once you start digging into your data, things get messy. Real-world marketing isn’t a clean math problem; it’s full of gray areas and weird scenarios that don't fit neatly into the "revenue divided by ad spend" box.
Let's clear up some of the most common hangups marketers run into. Think of this as your quick reference for those "what if" moments that can make or break your analysis. Getting these details right is the difference between fuzzy metrics and sharp, confident decisions.
What if a Sale Happens Days After an Ad Click?
This is the classic attribution puzzle. A customer clicks your ad on Monday but doesn't pull out their credit card until Friday. Does the Monday ad get credit? Absolutely.
This is where the conversion window comes in. Most ad platforms let you set a time period (like 7, 14, or 30 days) after an ad interaction. If a conversion happens within that window, the ad gets the credit it deserves.
The key is to pick a window that actually mirrors how your customers shop. If you’re selling an impulse-buy product, a short window is fine. But for a high-ticket item that people spend weeks researching, a longer window gives you a much truer picture of your ad's real influence.
Pro Tip: Don't just accept the platform's default conversion window. Dive into a tool like Google Analytics and see how long it actually takes for a new visitor to become a customer. Then, set your conversion window to match that behavior.
How Do I Handle Returns and Canceled Orders?
Returns are the silent killer of a good ROAS. One minute you’re celebrating a profitable campaign, the next a refund request turns that win into a loss. It's a pain to track, but you have to.
The only accurate way is to subtract the value of returned goods from your total revenue before you calculate ROAS.
- Initial Calculation: $10,000 Revenue / $2,500 Ad Spend = 4.0 ROAS
- After a $1,000 Return: $9,000 Revenue / $2,500 Ad Spend = 3.6 ROAS
This means you need your sales platform and your ad platform to talk to each other, either through a direct integration or by pulling reports manually. If you ignore returns, you're just lying to yourself with inflated numbers.
Should I Calculate ROAS for Each Channel Separately?
Yes. 100% yes. While a blended, overall ROAS is a decent high-level health check, it hides the most important details.
A killer performance on Google Ads could be masking a total money pit on Facebook. You'd never know if you only looked at the average.
By calculating ROAS for each individual platform—and even for specific campaigns within those platforms—you can spot your winners and losers with crystal clarity. This is what lets you shift your budget intelligently, pulling money from the duds and doubling down on what works. This is how you stop just measuring and start optimizing.
Understanding these nuances is what turns ROAS from a simple vanity metric into a powerful tool for growth. At Rebus, we help businesses navigate these complexities to build profitable, data-driven advertising strategies. Let us show you how to maximize your return.