
Measuring SEO Performance A Guide to Real Business Growth
Measuring SEO performance isn't just about watching traffic numbers go up and down. It's about connecting the dots between your hard work—all the content you create, the technical gremlins you fix—and what the business actually cares about: more traffic, better rankings, and ultimately, more conversions.
It’s how you prove your SEO strategy is delivering a real, measurable return, not just vanity metrics.
Laying The Groundwork For Smart SEO Measurement
Before you dive into a sea of charts and metrics, you have to answer one simple question: what does winning look like for us?
Jumping straight into data without a clear goal is like driving without a destination. Sure, you're moving, but you have no idea if you're getting any closer to where you want to be. A solid measurement plan always starts by aligning your SEO efforts with tangible business outcomes.
This is where you move past fluff—like obsessing over rankings for keywords that don't drive any real business—and get serious. For an e-commerce brand, success might be a 20% bump in organic revenue. For a B2B company, it could be a 15% lift in qualified leads from search. Each goal demands its own set of Key Performance Indicators (KPIs) to track progress.
Setting Goals And Choosing Your KPIs
Your business model is your North Star for picking the right SEO goals. A local plumber needs the phone to ring. A media site needs eyeballs for ad impressions and affiliate clicks. Your KPIs have to reflect that reality.
- E-commerce: The goal is simple: sales. Your main KPI should be organic revenue, with secondary metrics like organic conversion rate and average order value from search visitors telling the rest of the story.
- Lead Generation (B2B/Services): Here, success is all about new business inquiries. You'll want to focus on organic lead volume (think form fills or demo requests) and your cost per organic lead.
- Media/Publishers: It's an audience game. Keep a close eye on organic sessions, pages per session, and the ad revenue generated from organic users.
And don't forget that SEO isn't just for Google's main search results. For instance, if video is part of your strategy, you'll want to dig into some actionable YouTube SEO optimization tips to see how you're performing on the world's second-biggest search engine.
This quick guide should help you pick the right KPIs for your specific business.
Matching SEO KPIs To Business Models
| E-commerce | Organic Revenue | Conversion Rate, Avg. Order Value | Increase organic sales by 25% YoY. |
|---|---|---|---|
| Lead Generation | Organic Lead Volume | Cost Per Lead, Lead Quality Score | Generate 100 new MQLs from search per month. |
| Publisher/Media | Organic Sessions | Pages/Session, Ad Impressions | Grow organic traffic by 40% in 12 months. |
| Local Business | Local Pack Rankings | Phone Calls, "Get Directions" Clicks | Increase foot traffic from local search by 15%. |
| SaaS | Free Trial Sign-ups | Demo Requests, Activation Rate | Boost organic trial sign-ups by 30% in Q3. |
Once you've got the right KPIs locked in, you're ready for the next step.
Establishing Your Performance Baseline
So, you have your goals and you've picked your KPIs. Now what? You need a starting line. You can't measure growth if you don't know where you started from. This is where your baseline comes in—it's a snapshot of your current performance, typically looking back over the last 30, 90, or even 365 days.
Pull up the historical data for the KPIs you just selected. What were your organic traffic, keyword rankings, and conversion rates over the last year? This context is crucial. It helps you set realistic, data-backed targets instead of just pulling numbers out of thin air.
This whole process is about creating a logical flow, from big-picture business goals down to the nitty-gritty data points.
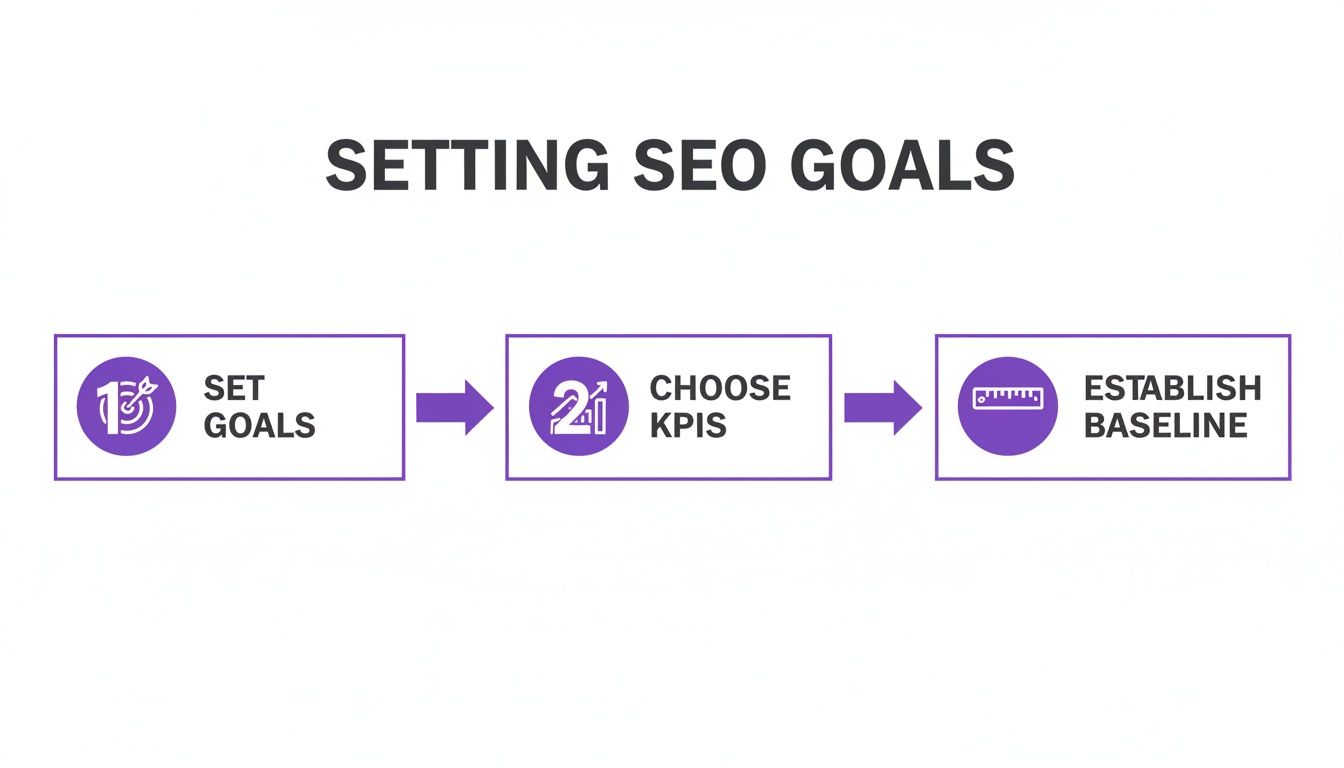
This simple framework reinforces that a structured approach is non-negotiable. Without this groundwork, your data is just a collection of numbers without the context needed to make smart decisions. Get this right, and you'll transform your SEO from a marketing cost into a predictable engine for business growth.
Setting Up Your SEO Tracking Toolkit
Let's get one thing straight: if you're not tracking SEO performance with the right tools, you're just guessing. Accurate data is the only thing that separates strategic SEO from wishful thinking. To get that data, your foundation rests on two free, ridiculously powerful platforms: Google Analytics 4 (GA4) and Google Search Console (GSC).
Everything we're about to cover hinges on getting these two set up correctly from the jump. It's a non-negotiable first step. If you're brand new to this, learning how to add Google Analytics to your site is your starting line. Get that done, then come right back.
Once you're wired up, your first job is to start tracking what actually moves the needle—conversions.

Nail Your Conversions in Google Analytics 4
GA4 is where the post-click story unfolds. It tells you what people do once they land on your site from a search. Are they buying? Filling out forms? Signing up for your newsletter? Page views are nice, but they don't pay the bills. You need to track the actions that drive revenue.
This all comes down to setting up conversion events. These are the specific, valuable user interactions you need to measure.
- For E-commerce: The holy grail is the purchase event. You need this configured to pull in all the juicy details like revenue and which products were sold. This gives you a crystal-clear line from an organic click straight to a sale.
- For Lead Generation: Your go-to is often a generate_lead event. This should fire the moment someone successfully submits a contact form or demo request. No more wondering if your traffic is any good; now you'll know.
Setting up events like these is how you start measuring traffic quality, not just quantity. For a more detailed walkthrough, our guide on setting up Google Analytics goals will get you squared away.
Unlock Pre-Click Gold with Google Search Console
If GA4 tells you what happens on your site, Google Search Console (GSC) tells you what happens before anyone even gets there. It's the raw, unfiltered truth directly from Google's search index.
This is where you see which search queries are getting you impressions (views) and clicks in the SERPs. You can track your average ranking position for keywords and, critically, your click-through rate (CTR). Think of GSC as your direct hotline to Google—it'll even alert you to technical hiccups or indexing problems that could be tanking your performance.
Create the Ultimate View by Linking GA4 and GSC
This is where the magic happens. By themselves, GA4 and GSC are powerful. Connected? They're a force multiplier. Linking them merges your pre-click and post-click data into one seamless view of the entire customer journey.
Once you link the accounts, you unlock dedicated Search Console reports right inside the GA4 interface. Suddenly, you can see the exact search queries that brought users to a specific landing page, right alongside all of GA4's juicy engagement and conversion metrics.
This integration lets you answer the questions that truly matter:
Which keywords are driving the most engaged traffic (think low bounce rates and high time-on-page)?
Which landing pages get tons of impressions in GSC but have terrible engagement in GA4? That's a huge red flag for a content or user experience problem.
Which search queries are bringing in visitors who actually convert into customers or leads?
By connecting these dots, you eliminate data silos and get the full picture, from the moment someone types a query into Google to the second they become a customer. Getting this technical foundation right is the first step to turning raw numbers into the kind of insights that fuel real SEO growth.
Using Organic Traffic To Measure Audience Growth
Organic traffic is the lifeblood of SEO. But let's be real—fixating on the total number of visitors is a rookie mistake. That one number doesn't tell you if you're attracting the right people or just getting a bunch of accidental clicks.
Measuring real SEO performance means digging way deeper. It's about figuring out if the audience you're pulling in from search is actually growing, engaging, and aligning with your business goals. Raw traffic can be easily inflated by low-quality visits that bounce immediately. The real win comes from analyzing trends to prove your brand's reach is expanding in a way that actually matters.
Analyzing Traffic Trends Over Time
A single month of data is just a snapshot. It tells you almost nothing. To see if your SEO is actually working, you need to zoom out and look at performance over longer periods.
Comparing traffic year-over-year (YoY) is my go-to method. It smooths out all the seasonal weirdness and shows you what’s really happening. For instance, a retail site will always see a traffic spike in Q4. Comparing November's traffic to October's is totally misleading. But comparing this November to last November? Now you're seeing the true impact of your SEO work, separate from the holiday rush.
This is where tracking organic traffic growth becomes a core metric. When SEO strategies are dialed in, it's not uncommon for websites to see an average upward trend of 20-30% year-over-year. For a closer look at these kinds of benchmarks, you can review historical data for SEO from GBC Digital Marketing.
Segmenting Your Data for Deeper Insights
Here's a hard truth: not all organic traffic is created equal. To get insights you can actually use, you have to slice and dice your data inside Google Analytics 4. It's the difference between knowing you got 10,000 visitors and knowing that 3,000 of them were on mobile, landed on a specific blog post, and stuck around for three minutes. See the difference?
Start breaking down your traffic by these dimensions:
- Landing Pages: Which pages are your organic home runs? Are they blog posts, service pages, or product pages? This tells you exactly what kind of content is clicking with your search audience.
- Device Type: Pit desktop against mobile and tablet. If your mobile traffic is huge but has a sky-high bounce rate, you’ve probably got a user experience problem on small screens that needs fixing ASAP.
- Country or Region: Where in the world is your audience? This is non-negotiable for local businesses and a goldmine for global brands planning their next move.
By isolating these segments, you stop looking at foggy, high-level numbers and start spotting specific opportunities. That high-traffic landing page with terrible engagement? It’s begging for a content refresh. The low-traffic page that converts like crazy? Time to double down and optimize the heck out of it.
Moving Beyond Clicks to Engagement
A ton of traffic is great for vanity, but if visitors hit the back button in three seconds, it's a hollow victory. This is where user engagement metrics come in. They tell you if the content you're ranking for actually delivers on its promise and satisfies what the user was looking for.
In GA4, keep a close eye on these:
- Average Engagement Time: This shows how long your page was actually the main focus in someone's browser. More time suggests people are genuinely reading and interacting.
- Engaged Sessions: A session counts as "engaged" if it lasts over 10 seconds, includes a conversion, or has at least two pageviews. This metric is great for filtering out the noise from accidental clicks.
- Views per User: Are people exploring your site after they land? A high number here means they find your stuff valuable and want to see what else you've got.
When you can show both high traffic volume and strong engagement, you’ve got a powerful story to tell. You’re not just attracting eyeballs; you’re building a captivated audience. And that is the foundation for turning search visibility into loyal customers and real, sustainable growth.
Gauging SERP Visibility With Impressions and CTR
High keyword rankings look great on a report, but they’re a vanity metric. They're a means to an end, not the end itself. The real gut-check question is this: are actual human beings seeing and clicking on your site in the search results?
This is where you graduate from just tracking rankings to measuring your true SERP real estate. Your key metrics here are impressions and click-through rates (CTR).
These two data points, found exclusively in Google Search Console, tell a powerful story. An impression is logged every time one of your pages shows up in someone's search results. A click, well, that’s when they choose your link over everyone else's. The magic happens when you analyze the relationship between them—that’s where your biggest optimization opportunities are hiding.
Beyond Rankings: Why Impressions Tell the Whole Story
Relying only on rank tracking tools gives you tunnel vision. You might be celebrating a #8 ranking for one keyword, but GSC could reveal that you're getting thousands of impressions for dozens of related long-tail variations you weren't even watching.
This is why impressions are a leading indicator of your content's topical authority. A steady climb in total impressions, even if specific rankings bounce around, shows that Google is trusting your site for a wider range of queries on a subject. It’s a huge sign that your content strategy is hitting the mark and your brand's footprint is expanding.
In fact, a core part of measuring SEO performance is digging into GSC's impressions and clicks, which paint a complete picture of SERP exposure. Data shows that top-performing sites see a 35-50% increase in total impressions year-over-year when they focus on broader query visibility, with clicks converting at a 2-5% CTR for top 10 positions globally.
This visibility is the foundation. Without impressions, you get no clicks, no traffic, and no conversions. Simple as that.
Finding Hidden Gems in Your CTR Data
Your click-through rate is the ultimate test of how compelling your search snippet is. It’s the percentage of impressions that actually turn into a click. A low CTR, especially for a page that ranks well, is a massive red flag waving right in your face.
This is where you can find some of the easiest SEO wins you'll ever get. Pop into your Google Search Console performance report and filter for pages or queries with high impressions but a disappointingly low CTR.
This simple filter is a goldmine. It points you directly to pages that Google already likes enough to show to a lot of people, but for whatever reason, users are scrolling right past them. The authority is there; the marketing message is failing.
So, what causes a low CTR? It’s usually one of these culprits:
- A Boring or Irrelevant Title Tag: Your title doesn't match what the user is looking for or just fails to grab their attention.
- A Weak Meta Description: The description under your title doesn't offer a compelling reason to click. Sometimes it's just a jumble of keywords that inspires zero confidence.
- Missing Rich Snippets: Your competitors are using structured data to show off star ratings, prices, or FAQs, making their results pop while yours looks painfully plain.
Fixing these elements can produce an almost immediate lift in traffic—often without any change to your actual rankings. For a deeper dive, you can learn more about what is a good click-through rate in our comprehensive guide.
Monitoring Trends to Stay Agile
Impressions and CTR aren't just for a one-time audit; they are vital for ongoing monitoring. A sudden, sharp drop in impressions across your whole site could signal a scary technical issue, like an indexing problem, or that you just got hit by a Google algorithm update.
On the flip side, after you publish a new piece of content or optimize an old one, watching its impressions trend upward in GSC is the very first sign of success. It means Google is picking up the page and starting to test it in the wild. By keeping a close eye on these metrics, you can quickly diagnose problems and validate that your hard work is paying off, giving you the agility to stay ahead.
Connecting SEO Efforts To Revenue And Conversions
Traffic and impressions are great vanity metrics, but they don't answer the C-suite's favorite question: "What is all this SEO work actually doing for our bottom line?" This is where you connect the dots between search visibility and real business results. It’s about proving that SEO is a revenue driver, not just a line item on the marketing budget.
The whole game hinges on meticulously tracking conversions. These are the specific, valuable actions a user takes that signal they're moving from a curious searcher to a potential customer. Tracking these actions is the only way to show a clear, undeniable return on investment.
Defining What A Conversion Means For You
First things first, you have to define what a "conversion" actually is for your business. It’s not the same for everyone. An action that’s a primary goal for one company might just be a nice-to-have for another.
Your mission is to pinpoint the key interactions that directly contribute to revenue or fill your sales pipeline. These are the non-negotiable events you need to measure inside Google Analytics 4.
Here are a few common examples:
- E-commerce: The holy grail is a purchase event. This draws a direct line from an organic click to a sale in the bank.
- Lead Generation: This is usually a generate_lead event, which fires when someone successfully submits a contact form, requests a demo, or signs up for a free trial.
- Content-Driven Businesses: For publishers or B2B companies deep in content marketing, a key conversion might be a newsletter_signup or a download of a gated asset like a whitepaper.
Once you have these events configured, you're no longer just reporting on traffic; you're reporting on the value of that traffic.
The ultimate measure of SEO performance isn’t just bringing people to your site—it’s bringing the right people who take valuable actions. Without conversion tracking, you’re flying blind, unable to tell the difference between traffic that pays the bills and traffic that just inflates your pageview count.
The conversion rate from organic traffic is the metric that truly bridges the gap between search visibility and tangible revenue. Data suggests that well-optimized websites can hit organic conversion rates between 2.5-4%, which is often 15-20% higher than what paid channels see in major markets. You can explore the research on SEO tracking from Swydo to dig deeper into these benchmarks.
Pinpointing Your Most Valuable Pages and Keywords
With conversion tracking dialed in, you can finally answer the most important questions about your SEO strategy. You can now move beyond asking "which pages get the most traffic?" and start asking, "which pages drive the most revenue?"
Dive into your Google Analytics 4 reports and take a hard look at your organic landing pages. When you sort them by conversions instead of by sessions, the picture often changes dramatically. You might discover that a blog post you dismissed as a "low traffic" page is actually a conversion powerhouse, pulling in high-intent visitors who are ready to act.
This insight is a complete game-changer. It tells you exactly where to focus your optimization efforts.
- High-Traffic, Low-Conversion Pages: These pages are great at attracting an audience but are failing to persuade them. This is your cue to improve the content, add stronger calls-to-action (CTAs), or fix user experience bottlenecks.
- Low-Traffic, High-Conversion Pages: This is your hidden gold. These pages clearly resonate with their audience. The mission here is simple: find ways to get more of the right people to see them through better rankings and smarter internal linking.
By linking your Google Search Console account with GA4, you can even drill down to the specific search queries that are driving these conversions. This data helps you double down on the keywords that attract buyers, not just browsers.
The Role Of Marketing Attribution
Let's be real: connecting SEO to revenue isn't always a straight line. A user might discover your brand through an organic search, leave, see a social media ad a week later, and finally convert by typing your URL directly into their browser. So, which channel gets the credit?
This is where attribution modeling comes into play. It’s the framework for assigning value to the various touchpoints a customer has on their path to conversion. Simply giving 100% of the credit to the final click (last-click attribution) often dramatically undervalues SEO’s role in starting the customer journey. You can learn more about how marketing attribution works in our complete guide to get a better handle on these models.
Exploring different models, like data-driven attribution in GA4, gives you a much more accurate picture of how your organic search efforts contribute to the bottom line, even when they aren't the last touchpoint. This holistic view is crucial for justifying your budget and building a truly integrated digital strategy.
Got Questions About Measuring SEO? We’ve Got Answers.

Even with the perfect framework, you’re bound to hit a few head-scratchers once you dive into the data. Let’s tackle some of the most common questions that pop up when you start measuring SEO performance.
How Often Should I Be Checking My SEO Metrics?
This is a classic. The honest answer? It depends. Checking some metrics daily will drive you crazy, while ignoring others for months is just bad practice.
Here’s a practical schedule most seasoned pros follow:
- Daily or Weekly Checks: Keep a close eye on organic traffic and conversions. A sudden, sharp drop here is your early warning system for a technical disaster, like your server going down or a botched indexing update.
- Monthly Analysis: This is your sweet spot for things like keyword rankings, CTR, and impressions. These numbers bounce around a lot day-to-day, so looking at them over a month gives you a much clearer picture of actual trends versus random noise.
- Quarterly Review: Zoom out to look at the big picture. This is the time to assess backlink profile growth, shifts in domain authority, and your overall share of voice. These are slow-burn metrics, so you need a longer timeframe to see meaningful progress.
Constantly refreshing your dashboard is a recipe for reactive, panicked decisions. Get into a rhythm, stick to it, and focus on strategy, not static.
The point of measuring SEO isn’t to freak out over every little dip. It's about building a consistent habit that helps you spot real trends, prove your strategy is working, and make smart adjustments without getting lost in the daily chaos.
What's The Real Difference Between GA4 and Search Console?
Ah, the classic duo. Both are free, both are from Google, and both are absolutely essential. But they tell two completely different parts of the story.
Think of it as pre-click versus post-click.
- Google Search Console is all about the pre-click world. It shows you how your site performs on Google's search results page (the SERP). It’s your source for impressions, clicks, CTR, and average keyword positions. It’s a direct line into how Google sees you.
- Google Analytics 4 (GA4) handles everything post-click. It kicks in the second someone lands on your site, tracking what they do next. This is where you find engaged sessions, conversions, bounce rates, and, most importantly, revenue.
The magic happens when you link them. Integrating Search Console with GA4 pulls that crucial pre-click data right into your analytics reports. Suddenly, you can see exactly which search queries brought people to your site and what they did once they got there. That connection is the key to figuring out which keywords actually make you money.
How Do I Actually Measure the ROI of SEO?
This is the million-dollar question—literally. Measuring SEO Return on Investment (ROI) is how you stop defending your budget and start proving your value. At its core, you’re just comparing the money you made from organic search to what you spent to make it.
The simple formula is: (Organic Revenue - SEO Investment) / SEO Investment.
The tricky part is figuring out that "Organic Revenue" number. Here’s how it breaks down for different businesses:
For E-commerce: You’ve got it easy. Just track the purchase event in GA4, filter for your organic user segment, and voilà—there’s your direct revenue.
For Lead Generation: This takes a bit more math. You have to put a dollar value on a lead. First, calculate your lead-to-customer rate. Then, figure out the average lifetime value (LTV) of a new customer. If 1 in every 10 leads becomes a customer worth $5,000, then each lead from organic search is worth $500. Multiply that by your total organic leads, and you have your estimated revenue.
Your SEO investment is everything you spend: agency retainers, in-house team salaries, and all those tool subscriptions. Nail down your costs and your revenue attribution, and you’ll have an ROI calculation that any CFO would respect.
At Rebus, we turn messy data into clear, actionable strategy. Our experts help businesses build measurement frameworks that tie every SEO action directly to revenue. Stop guessing what works. Partner with us to supercharge your marketing and get the measurable results you’ve been looking for.