What Is a Good Conversion Rate and How Do You Measure Yours?
"So, what's a good conversion rate?"
That's the million-dollar question, isn't it? The short, textbook answer is that a good conversion rate usually falls somewhere between 2% and 5%. But honestly, that figure is about as useful as a screen door on a submarine.
The real answer is: it completely depends on your industry, what you're selling, and where your traffic is coming from.
Let’s Get Real: What Is a “Good” Conversion Rate, Anyway?
Think of it like this: what’s a “good” price for a vehicle? A brand-new semi-truck for $100,000 is a steal. A used bicycle for the same price is... well, you get the point. Context is everything.
A 1% conversion rate might be phenomenal for a B2B software company selling $50,000 annual contracts. On the flip side, a 1% rate for an e-commerce store slinging $15 t-shirts could be a one-way ticket to going out of business.
Before you can even benchmark your performance, you have to nail down what a “conversion” actually means for you.
What Are We Even Counting as a Conversion?
A "conversion" isn't always a cha-ching from a cash register. It’s any specific, valuable action you want a visitor to take. It's the moment a casual browser becomes an engaged prospect.
So, what are we measuring? It could be any of these:
- E-commerce Sale: The classic. Someone buys something.
- Lead Generation: A user fills out your "Request a Demo" or "Contact Us" form.
- Newsletter Signup: A visitor hands over their email for your mailing list.
- Content Download: Someone grabs that whitepaper or ebook you worked so hard on.
- Account Creation: A user signs up for a free trial or creates a profile.
Once you’ve defined your main goal, the math is simple. If you want to dig deeper into the basics, our full guide on what is conversion rate in marketing has you covered.
The formula is dirt simple: (Number of Conversions / Total Visitors) x 100 = Conversion Rate.
If 100 people land on your page and 3 of them sign up, boom—you have a 3% conversion rate. This little number is one of the most honest indicators of whether your marketing is actually working.
A Quick Look at Industry Averages
To give you a rough map of the territory, it helps to see what “good” looks like in different arenas. The table below offers a general baseline, but treat these numbers as a compass, not a GPS. They lump together all sorts of businesses, so your mileage will absolutely vary.
Quick Look at Good Conversion Rates By Goal
| E-commerce Purchase | 1% - 4% | Sales |
|---|---|---|
| B2B Lead (Form Fill) | 2% - 5% | MQLs, SQLs |
| Email/Newsletter Signup | 3% - 7% | New Subscribers |
| SaaS Free Trial Signup | 2% - 10% | New Trial Accounts |
| Content Download | 10% - 25%+ | Gated Content Leads |
Remember, a single conversion is just one chapter in a much larger story. A lower conversion rate can be perfectly healthy if those customers stick around and spend more over time. That’s why it’s critical to also get a handle on metrics like Customer Lifetime Value (LTV)—it puts your conversion rate into its proper business context.
How You Stack Up with Conversion Rate Benchmarks
Comparing your conversion rate to industry benchmarks is a lot like checking your speed on the highway. It tells you if you're keeping pace, falling behind, or maybe even leading the pack. But just like on the road, context is everything—a sports car and a moving truck have very different ideas of what "fast" means.
Knowing the average conversion rate is only helpful if you understand the story behind the numbers. Different industries have wildly different customer behaviors, price points, and sales cycles. All of this creates a unique standard for performance.
A high-frequency, low-cost purchase will almost always convert better than a high-cost, considered decision. This is why you should treat benchmarks as a starting point for your analysis, not the final report card on your success.
E-commerce Conversion Rates: An Industry Snapshot
In the world of online shopping, conversion rates can be all over the map depending on what you're selling. The global average for e-commerce conversion rates usually hovers somewhere between 2% and 4%, but that broad number hides the juicy details.
For instance, personal care products often see some of the highest rates, around 6.8%, because they're driven by repeat buys and lower prices. Food and beverages aren't far behind, converting at nearly 4.9%.
On the flip side, industries like retail (think fashion or jewelry) are closer to 1.9%, and home decor can dip to 1.4%. This makes sense—these are more expensive items that require a longer thought process. You can always explore more e-commerce benchmarks to get a feel for these industry-specific trends.
This chart gives you a clearer picture of how conversion goals differ across common business models.
As you can see, things like lead generation and signups often have much higher conversion rates than a direct e-commerce sale. That's simply because the initial commitment from the user is much lower.
Diving Deeper Into Specific Verticals
Every industry plays by its own rules, and those rules shape what a "good" conversion rate actually looks like. A user's mindset when searching for a law firm is entirely different from someone browsing for a new pair of sneakers, and the benchmarks reflect that reality.
Let’s break down a few key sectors:
- Professional Services (Law, Finance, Consulting): Trust is the main currency here. Conversions—usually a consultation or a quote request—are heavily influenced by reputation, testimonials, and clear communication. A good rate might be 3% to 5%, but the value of a single conversion is massive.
- SaaS (Software-as-a-Service): The goal here is almost always a free trial or a demo signup. Rates can swing wildly from 2% to 10%. The companies that land on the higher end of that scale usually have a crystal-clear value proposition and a dead-simple signup process.
- Lead Generation (B2B): For businesses selling to other businesses, the conversion is often a content download (like a whitepaper) or a webinar registration. These top-of-funnel actions can see huge conversion rates, sometimes 10% or more, because the user gets immediate value for a very low commitment.
It's not just about the final sale. A "good" conversion rate is one that profitably acquires customers or qualified leads. For a high-ticket B2B service, a 0.5% conversion rate might be fantastic, while a low-cost e-commerce store could go out of business with a 1.5% rate.
Ultimately, your real job is to understand the specific dynamics of your market. Are your customers making impulse buys, or are they doing weeks of research? Is your product a necessity or a luxury?
Answering these questions gives you the context you need to interpret benchmarks correctly. Use these numbers as a guidepost—not a finish line—to set realistic goals and find the right areas for improvement. That's how you turn data into a strategic advantage instead of just another number to chase.
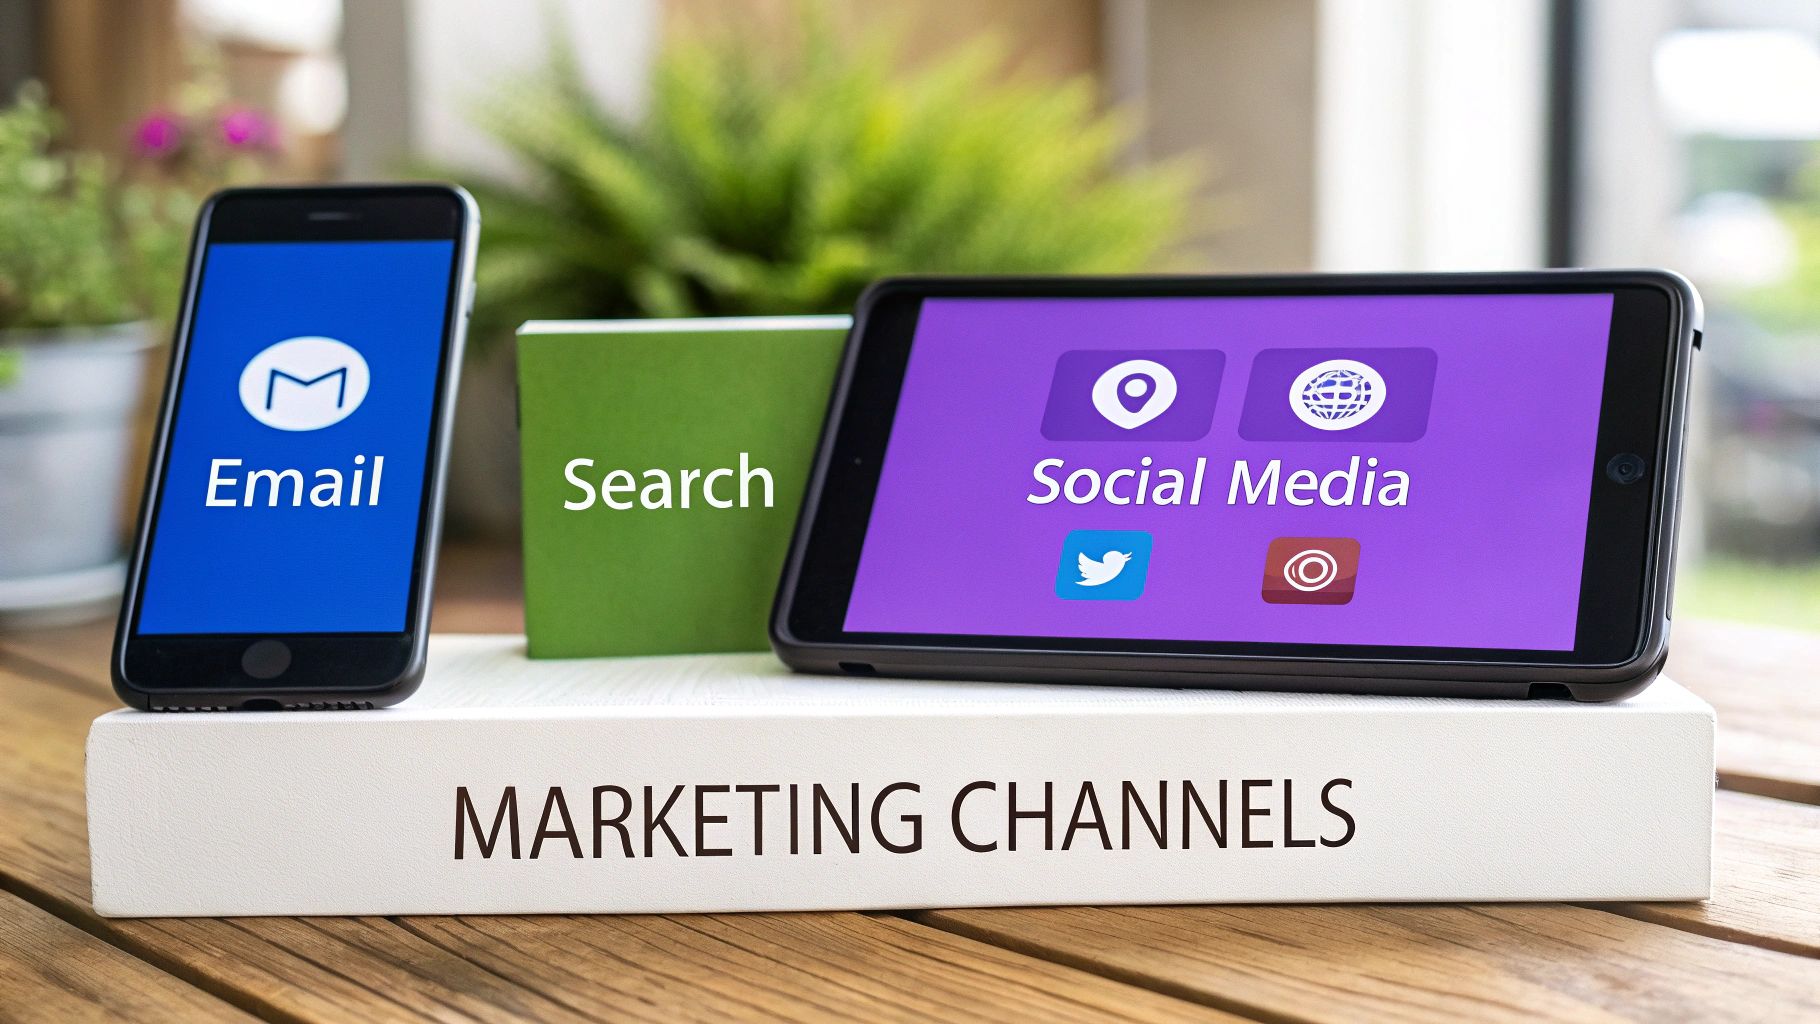
Why Different Marketing Channels Convert Differently
Here’s a hard truth: not all traffic is created equal. Comparing conversion rates across your marketing channels without context is a recipe for bad decisions.
Think of it like this: you're a street performer. The crowd that intentionally stops to watch your act is far more likely to drop a dollar in your hat than random passersby just rushing to their next meeting. Your marketing channels work the exact same way.
The single biggest reason for this difference is user intent. Each channel attracts an audience with a completely different mindset. Someone clicking your ad from a Google search has a different goal than someone scrolling through Instagram. Once you get that, you can set realistic expectations and make much smarter calls on where to put your time and budget.
High-Intent vs. Low-Intent Channels
Every visitor lands on your website with a different purpose. Some are ready to pull out their credit card right now. Others are just starting their research, kicking the tires, or killing time. The channel they came from is a massive clue about their state of mind.
We can split these channels into two basic camps:
- High-Intent Channels: These are the gold mines. They capture people who are actively searching for a solution to a problem they already have. Think paid search ads or organic search results for specific, "I-need-this-now" keywords.
- Low-Intent Channels: This is where you find people who are just hanging out. They might be scrolling social media or browsing content for fun. Your job here is to interrupt their day with something so compelling it sparks their interest out of the blue.
The key takeaway is simple: user intent dictates conversion potential. A user typing “buy size 10 running shoes” into Google is fundamentally different from someone seeing a running shoe ad while scrolling through Instagram. Their motivations are worlds apart, and their likelihood to convert reflects that.
Grasping this distinction is the first step toward accurately judging what a "good" conversion rate actually looks like for your business.
Comparing Conversion Rates Across Major Channels
So, how does this all play out in the real world? The performance gaps between channels are huge. Some are built for nurturing long-term relationships, while others are designed to capture immediate demand. This is why their average conversion rates can be so wildly different.
Take email marketing. It’s a conversion powerhouse, pulling in an average conversion rate of around 10.3%—often more than three times the rate of other channels. Why? Because you’re talking to a warm audience that already gave you permission to be in their inbox. That pre-existing relationship builds trust and keeps your brand top of mind. For a deeper dive, check out the channel conversion rate comparisons on Ruler Analytics.
Here’s a quick look at how other channels stack up:
- Paid Search (PPC): This channel is a beast for capturing high-intent users. People are actively searching for what you sell, so you can put your solution right in front of them. This direct match between problem and solution leads to strong conversion rates, often in the 2% to 3% range.
- Organic Search (SEO): Just like paid search, SEO traffic can be extremely high-intent. But it also attracts people who are earlier in their research phase, gathering information before they're ready to buy. This mix results in a solid average conversion rate of about 2.7%. To see how these two search channels work together, check out our guide on paid search vs. SEO.
- Social Media: Users on platforms like Facebook or LinkedIn are typically in a passive discovery mode. They aren't actively shopping; they're connecting and consuming content. This makes social a fantastic channel for brand awareness, but direct conversions are naturally lower, often hovering around 1%.
When you segment your data and look at performance channel by channel, you can stop chasing a single, mythical conversion rate. Instead, you can focus on optimizing each channel based on its unique strengths and the mindset of the audience it delivers.
The Core Factors That Influence Your Conversion Rate
Knowing your industry benchmarks is like having a map. But a map doesn't tell you how to navigate the actual terrain of your own website. To really move the needle, you have to go from the "what" (your current conversion rate) to the "why" (the reasons it is what it is).
Think of your website like a physical store. You could have the best products in town, but if the aisles are a mess, the checkout line is a mile long, and the staff is nowhere to be found, people are going to walk right out. Your conversion rate is the direct result of that entire customer experience.
Several core factors are always in play, working together to either help or hurt you. By breaking them down, you can stop guessing and start strategically fixing what’s holding you back.
The Clarity and Appeal of Your Offer
At its heart, a conversion is a simple value exchange. The user gives you their time, info, or money, and you give them a solution to their problem. If the value of your offer isn't blindingly obvious, the whole deal falls apart right then and there.
Can a visitor understand what you’re offering within five seconds? They shouldn't have to play detective. Your headline and opening sentences must instantly answer three questions:
What is this? Spell out the product or service. No jargon.
Who is it for? Make your target audience feel like you’re talking directly to them.
What problem does it solve? Focus on the benefit, not just the features.
A vague offer creates confusion, and a confused mind always says no. For example, "Next-Gen Synergy Platform" is meaningless corporate fluff. "Simple Accounting Software for Freelancers" is a crystal-clear solution. The more specific and compelling you are, the less friction a user feels on their way to converting.
The User Experience and Page Design
Your site’s design isn't just about looking pretty; it’s the foundation of the user's entire journey. A clunky, slow, or confusing website is the digital equivalent of a store with broken shelves and flickering lights. It kills trust and creates frustration, sending potential customers straight to your competitors.
A study by Google found that 53% of mobile users will bail on a site that takes longer than three seconds to load. Speed isn't a tech-nerd metric; it's a critical conversion factor. Every single second of delay is costing you money.
Beyond pure speed, you have to nail these UX fundamentals:
- Mobile Responsiveness: Does your site look and work flawlessly on a phone? With most traffic coming from mobile, a bad mobile experience is simply unacceptable.
- Intuitive Navigation: Can people find what they’re looking for without thinking? A clear menu, logical page structure, and a search bar that actually works are non-negotiable.
- Readability: Is your text a pain to read? Use clean fonts, short paragraphs, and plenty of white space. Don’t build a wall of text nobody will climb.
The Strength of Your Trust Signals
Every visitor lands on your site with a healthy dose of skepticism. Before they’ll even think about handing over their email or credit card number, you have to earn their trust. Trust signals are the visual cues that reassure users they're making a safe, smart decision.
These signals act as powerful social proof and security validation, calming the anxieties that stop conversions dead in their tracks.
- Customer Reviews and Testimonials: Nothing beats authentic feedback from real people. It proves you deliver on your promises.
- Security Badges: Logos from trusted names like Norton or McAfee, especially near payment forms, tell users their data is safe and secure.
- Case Studies and Client Logos: If you’re B2B, showing you’ve worked with other reputable companies builds instant credibility. It’s the ultimate "they trust us, so you can too."
- Guarantees and Return Policies: A clear, fair return policy completely removes the risk from the purchase, making it much easier for a user to say "yes."
Without these signals, you're asking visitors to take a blind leap of faith. With them, you’re giving them a safety net that encourages them to convert.
Actionable Strategies to Improve Your Conversion Rate
Alright, so you know your conversion rate. Now for the fun part: making it better. This whole process is called Conversion Rate Optimization (CRO), and it’s where you turn your existing traffic into real business growth. Think of it less like a massive website overhaul and more like a series of smart, data-backed tweaks that make it easier for people to say "yes."
But before you start messing with button colors or rewriting headlines, you have to get your foundation right. If your data is messy, your optimization efforts are just shots in the dark. That means implementing proper conversion tracking is the non-negotiable first step. Get that locked in, then you can start playing.
Run Smarter A/B Tests
A/B testing (or split testing) is the heart and soul of CRO. It’s simple, really: you create two versions of a page—an "A" version and a "B" version—and show each to a different chunk of your audience to see which one gets more people to act. The trick is to stop testing random stuff and focus on the high-impact areas first.
- Headlines: This is the first thing anyone reads. Test a headline that hammers on a user's pain point against one that focuses on your slick features.
- Calls-to-Action (CTAs): The words on your buttons can make or break a conversion. Try an action-focused phrase like "Get Your Free Demo" versus a benefit-driven one like "Start Saving Time Today."
- Page Layout: You'd be surprised what a difference this makes. Sometimes, just moving a form or a killer testimonial above the fold can give you a serious lift.
Remember: The point of an A/B test isn’t just to find a "winner." It's to learn what your audience actually cares about. Every test, win or lose, gives you priceless insight into their heads.
Optimize for Speed and Mobile Users
In a world of instant gratification, a slow website is a conversion death sentence. Seriously. Even a one-second delay in page load time can cause a 7% drop in conversions. Your site needs to be lightning-fast on every device, period.
Just as critical is the mobile experience. Most of your traffic is probably coming from phones anyway, so your site needs to be more than just "mobile-friendly"—it has to be mobile-first. That means you design the experience for the smallest screen first and then scale it up. Every button should be easily tappable with a thumb, and every form should be a breeze to fill out on the go.
Eliminate Friction in Your Forms
Your forms are often the last hurdle between a visitor and a conversion. Every single field you add is another reason for someone to give up and leave. Think of each field as a small fence; pile up too many, and your visitor will just abandon the race.
Here’s how to slash that friction and get more people to the finish line:
Cut the fat. Do you really need their phone number right now? Or their company size? Stick to the absolute essentials.
Use obvious labels. Don't make people guess what you're asking for. Pop the labels right above the input fields where they're easy to see.
Write helpful error messages. Instead of a generic "Error," tell them exactly what’s wrong, like "Oops! Please enter a valid email address."
Show them the light at the end of the tunnel. For longer, multi-step forms, a simple progress bar works wonders to manage expectations and keep them moving.
High-Impact Conversion Optimization Tactics
Not all CRO tactics are created equal. Some changes deliver massive results with minimal effort, while others require a heavy lift for a smaller payoff. Here's a quick cheat sheet to help you prioritize your efforts.
| Simplify and Shorten Forms | High | Low |
|---|---|---|
| A/B Test Headlines and CTAs | High | Low |
| Improve Page Load Speed | High | Medium |
| Add Social Proof (Reviews, Testimonials) | High | Low |
| Create a Dedicated Landing Page for Ads | High | Medium |
| Optimize for Mobile-First Experience | High | High |
| Implement Live Chat or a Chatbot | Medium | Medium |
| Add Exit-Intent Popups | Medium | Low |
| Redesign Your Entire Website | Very High | Very High |
Focus on the "High Impact, Low Effort" tactics first to score some quick wins. This builds momentum and gives you the data you need to tackle the bigger, more complex projects later on.
Common Questions About Conversion Rates
Once you start digging into conversion metrics, a few questions always seem to bubble up. Getting straight answers is the key to moving from just knowing the theory to actually putting it to work. Let's clear up some of the most common head-scratchers.
How Long Should I Run a Test to Measure Conversions?
One of the biggest mistakes you can make is calling an A/B test too early. You might see a spike on day one and get excited, but that's just noise. To get results that aren't just a lucky guess, you need a decent sample size—we're talking hundreds of conversions for each version of your test.
A good rule of thumb is to let it run for at least one full business cycle, maybe a week or two. This helps smooth out the weird ups and downs that happen on different days. Patience is the name of the game here; let the test run its course to get data you can actually trust.
Is a Low Conversion Rate Always a Bad Sign?
Absolutely not. Context is everything. If you're selling enterprise software with a six-figure price tag or high-end legal services, your sales cycle is long and the consideration phase is intense. In these cases, a conversion rate way under 1% can still be wildly profitable.
Think about it: just one or two closed deals could be worth tens of thousands of dollars.
The real report card isn't the conversion rate in isolation. It’s how that rate plays with other critical numbers, like your Customer Lifetime Value (CLV) and Cost Per Acquisition (CPA). A handful of massive, high-value conversions will always beat thousands of tiny, low-quality ones.
What Are the Best Tools for Tracking Conversion Rates?
You can't fix what you don't measure, so having the right toolkit is non-negotiable. While there are a million options out there, a few stand out as the go-to choices for tracking and improving your numbers.
- For Foundational Tracking: Google Analytics is the bedrock. If you don't have this set up, stop everything and do it now. It's the source of truth for your traffic and conversions. To get started, you'll need to learn about setting up Google Analytics goals.
- For A/B Testing: To actually improve your pages, you need to experiment. Tools like Google Optimize, Optimizely, or VWO let you run controlled tests on headlines, calls-to-action, and page layouts to see what really works.
- For Understanding User Behavior: To figure out why people aren't converting, you need to see what they're doing. Tools like Hotjar or Crazy Egg give you heatmaps and session recordings, showing you exactly where visitors get frustrated, confused, or stuck.
Should I Focus on More Traffic or a Better Conversion Rate?
For almost every business, the answer is clear: focus on your conversion rate first. This whole process is called Conversion Rate Optimization (CRO), and it delivers a much better bang for your buck.
Think of it this way: driving more traffic to a website that doesn't convert well is like pouring water into a leaky bucket. You just waste a ton of money and effort.
First, fix the leaks in your funnel. Once your site is a lean, mean, conversion-generating machine, then you can confidently open the floodgates on your traffic sources and watch your business grow profitably.
Ready to stop guessing and start growing? The expert team at Rebus builds data-driven marketing strategies that turn clicks into customers. Partner with us to supercharge your conversions and drive sustainable revenue growth.